Python figure參數(shù)及subplot子圖繪制代碼
1. Python的figure參數(shù)主要有:
def figure(num=None, # autoincrement if None, else integer from 1-N figsize=None, # defaults to rc figure.figsize dpi=None, # defaults to rc figure.dpi facecolor=None, # defaults to rc figure.facecolor edgecolor=None, # defaults to rc figure.edgecolor frameon=True, FigureClass=Figure, clear=False, **kwargs ):
可以設(shè)置圖片大小、分辨率、顏色等。
2. subplot子圖繪制,子圖的繪圖參數(shù)可以分別設(shè)置
plt.figure(1)x1 = np.linspace(-0.2, 2, 10)y1 = x1**2 + 0.3plt.subplot(121)plt.scatter(x1, y1)plt.xlabel(’X’)plt.ylabel(’Y’)plt.title(’test_1’)x2 = np.linspace(-0.2, 2, 10)y2 = x2 + 0.3plt.subplot(122)plt.plot(x2, y2, color='red', linewidth=1.0, marker = ’s’, linestyle='--')## plt.plot(x, y, color='#ef5492', linewidth=2.0, marker = ’s’, linestyle='--')# plt.plot(x2, y2, ’rs--’) plt.xlabel(’X’)plt.ylabel(’Y’)plt.title(’test_2’)plt.show()
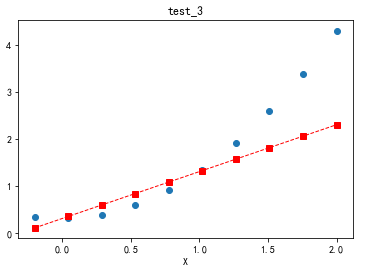
3. 在同一張圖片上顯示多種圖形,簡單說把 plt.show()放在最后即可
import matplotlib.pyplot as pltimport numpy as npplt.figure(2)x1 = np.linspace(-0.2, 2, 10)y1 = x1**2 + 0.3plt.scatter(x1, y1)x2 = np.linspace(-0.2, 2, 10)y2 = x2 + 0.3plt.plot(x2, y2, color='red', linewidth=1.0, marker = ’s’, linestyle='--')## plt.plot(x, y, color='#ef5492', linewidth=2.0, marker = ’s’, linestyle='--')# plt.plot(x2, y2, ’rs--’) plt.xlabel(’X’)plt.ylabel(’Y’)plt.title(’test_3’)plt.show()
以上就是本文的全部內(nèi)容,希望對大家的學(xué)習(xí)有所幫助,也希望大家多多支持好吧啦網(wǎng)。
相關(guān)文章:
1. nestjs實現(xiàn)圖形校驗和單點登錄的示例代碼2. html小技巧之td,div標(biāo)簽里內(nèi)容不換行3. 以PHP代碼為實例詳解RabbitMQ消息隊列中間件的6種模式4. laravel ajax curd 搜索登錄判斷功能的實現(xiàn)5. Python 如何將integer轉(zhuǎn)化為羅馬數(shù)(3999以內(nèi))6. python實現(xiàn)自動化辦公郵件合并功能7. 將properties文件的配置設(shè)置為整個Web應(yīng)用的全局變量實現(xiàn)方法8. python開發(fā)飛機(jī)大戰(zhàn)游戲9. Echarts通過dataset數(shù)據(jù)集實現(xiàn)創(chuàng)建單軸散點圖10. css進(jìn)階學(xué)習(xí) 選擇符

 網(wǎng)公網(wǎng)安備