python圖像處理基本操作總結(jié)(PIL庫、Matplotlib及Numpy)
1、讀取圖片
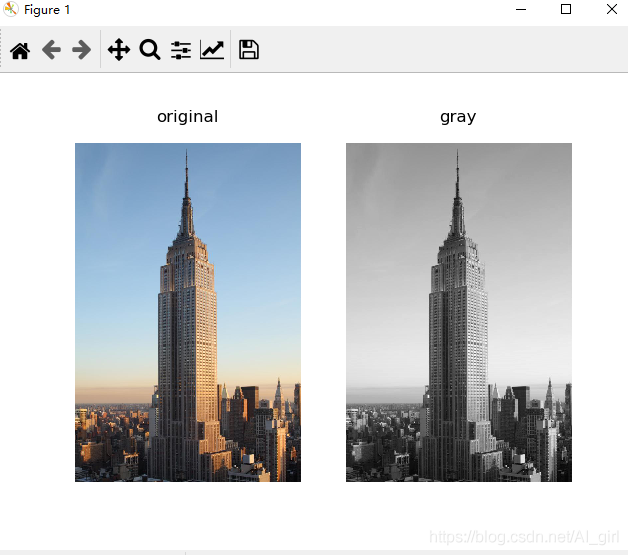
PIL網(wǎng)上有很多介紹,這里不再講解。直接操作,讀取一張圖片,將其轉(zhuǎn)換為灰度圖像,并打印出來。
from PIL import Imageimport matplotlib.pyplot as pltpil_im = Image.open('empire.jpeg')pil_image = pil_im.convert('L')plt.gray()plt.imshow(pil_image)plt.show()
輸出如下所示:
2、轉(zhuǎn)換圖片格式
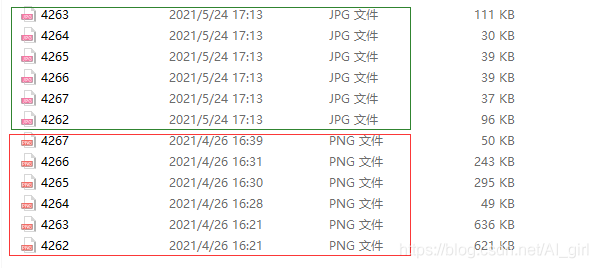
PIL可以將圖像保存為多種格式,下面將PNG格式文件保存為JPG格式:
from PIL import Imageimport globimport osfilelist = glob.glob('E:/pythonProject1/filelist/*.png')for infile in filelist: outfile = os.path.splitext(infile)[0]+’.jpg’ if infile != outfile:try: Image.open(infile).save(outfile)except IOError: print('cannot convert', infile)
輸出結(jié)果如下所示:
3、輸出文件夾中所有圖片的文件名列表
import osdef get_imlist(path): '''返回目錄中所有JPG圖像的文件名列表''' return [os.path.join(path,f)for f in os.listdir(path) if f.endswith(’.jpg’)]print(get_imlist('E:/pythonProject1/filelist/'))
輸出為文件名列表
二、Matplotlib1、繪制圖像、點(diǎn)和線
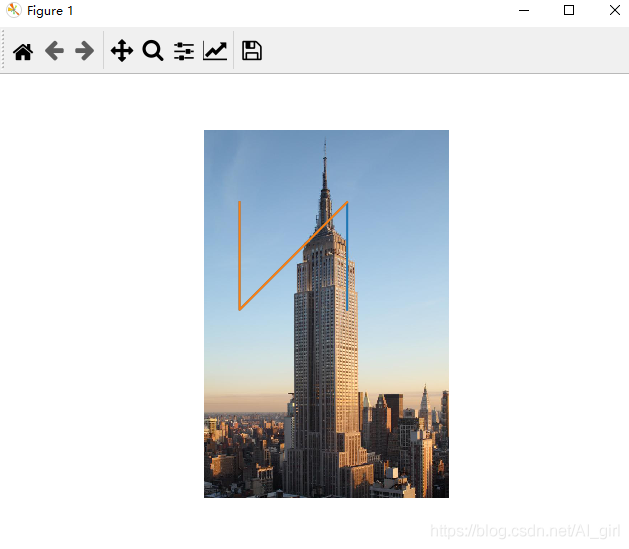
from PIL import Imagefrom pylab import * #讀取圖像到數(shù)組中im = array(Image.open('empire.jpeg')) #繪制圖像imshow(im) #一些點(diǎn)x = [100, 100, 400, 400]y = [200, 500, 200, 500] #使用紅色星狀標(biāo)記繪制點(diǎn)plot(x, y)#默認(rèn)為藍(lán)色實(shí)線# plot(x, y, ’r*’)#紅色星狀標(biāo)記# plot(x, y, ’go-’)#帶有圓圈標(biāo)記的綠線# plot(x, y, ’ks’)#帶有正方形標(biāo)記的黑色虛線 #繪制連接前三個(gè)點(diǎn)的線plot(x[:3], y[:3])axis(’off’) #添加標(biāo)題,顯示繪制的圖像titles = [’empire’]plt.title = titlesshow()
上面的代碼首先繪制出原始圖像,然后在 x 和 y 列表中給定點(diǎn)的 x 坐標(biāo)和 y 坐標(biāo)上繪制出紅色星狀標(biāo)記點(diǎn),最后在兩個(gè)列表表示的前兩個(gè)點(diǎn)之間繪制一條線段。該例子的繪制結(jié)果下圖:
2、圖像輪廓和直方圖
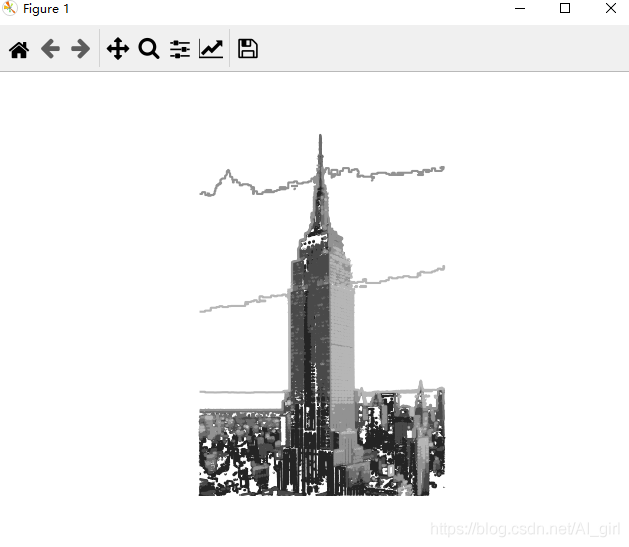
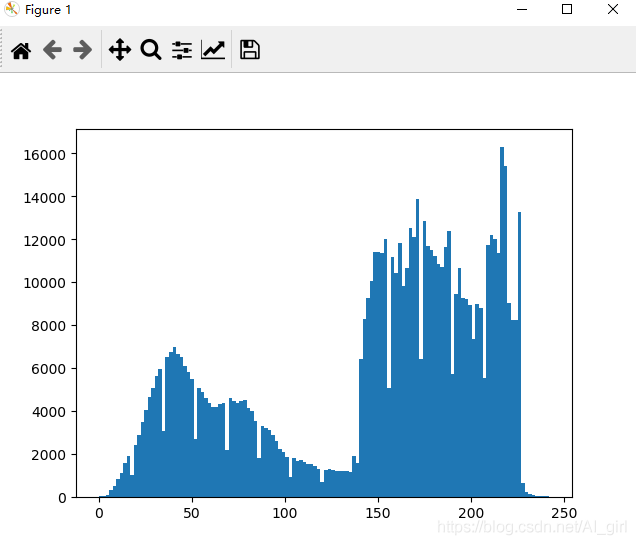
繪制輪廓需要對每個(gè)坐標(biāo) [x, y] 的像素值施加同一個(gè)閾值,所以首先需要將圖像灰度化,這里用 PIL 的 convert() 方法將圖像轉(zhuǎn)換成灰度圖像。圖像的直方圖用來表征該圖像像素值的分布情況。
from PIL import Imagefrom pylab import * # 讀取圖像到數(shù)組中im = array(Image.open('empire.jpeg').convert(’L’)) #創(chuàng)建一個(gè)圖像figure()#不使用顏色信息gray()#在原點(diǎn)的左上角顯示輪廓圖像contour(im, origin = ’image’)#檢測圖像輪廓axis(’equal’)axis(’off’)show()#新建一個(gè)圖像figurehist(im.flatten(), 128)#繪制圖像直方圖show()
圖像輪廓圖輸出如下所示:
輸出圖像直方圖如下所示:
3、交互式標(biāo)注
在一幅圖像中標(biāo)記一些點(diǎn),或者標(biāo)注一些訓(xùn)練數(shù)據(jù)。PyLab 庫中的 ginput() 函數(shù)就可以實(shí)現(xiàn)交互式標(biāo)注。在圖像點(diǎn)擊三次,則程序會(huì)自動(dòng)將這3個(gè)點(diǎn)的坐標(biāo)點(diǎn)[x, y]保存到x列表里。
from PIL import Imagefrom pylab import * im = array(Image.open('empire.jpeg'))imshow(im)print('please click 3 points')x = ginput(3)print('you clicked',x)show()三、Numpy
1、圖像數(shù)組表示
對于圖像數(shù)據(jù),下面的例子闡述了這一點(diǎn)
from PIL import Imageimport numpy as np im = np.array(Image.open('empire.jpeg'))print(im.shape,im.dtype)
輸出為:(1024, 683, 3) uint8
每行的第一個(gè)元組表示圖像數(shù)組的大小(行、列、顏色通道),緊接著的字符串表示數(shù)組元素的數(shù)據(jù)類型。因?yàn)閳D像通常被編碼成無符號(hào)八位整數(shù)(uint8),載入圖像并將其轉(zhuǎn)換到數(shù)組中,數(shù)組的數(shù)據(jù)類型為“uint8”。
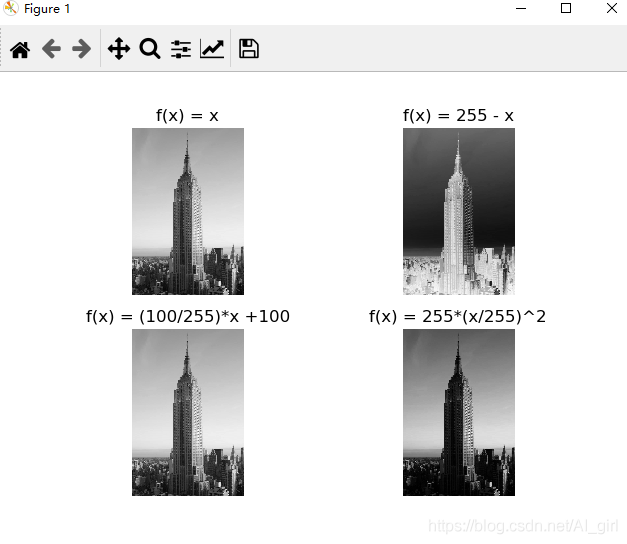
2、灰度變換
對圖像進(jìn)行灰度變換,如下所示:
from PIL import Imageimport numpy as np im = np.array(Image.open('empire.jpeg'))print(im.shape,im.dtype) from PIL import Imagefrom matplotlib.pylab import pltfrom numpy import * im1 = array(Image.open(’empire.jpeg’).convert(’L’))im2 = 255 - im1 #對圖像進(jìn)行反向處理im3 = (100.0/255) * im1 + 100 #將圖像值變換到100-200之間im4 = 255.0 * (im1/255) ** 2 #對圖像像素值求平方后得到的圖像 images = [im1, im2, im3, im4]titles = ['f(x) = x', 'f(x) = 255 - x', 'f(x) = (100/255)*x +100', 'f(x) = 255*(x/255)^2']#輸出圖中的最大像素值和最小像素值print(int(im1.min()),int(im1.max()))print(int(im2.min()),int(im2.max()))print(int(im3.min()),int(im3.max()))print(int(im4.min()),int(im4.max())) for i in range(4): plt.subplot(2, 2, i+1)#2行2列,按編號(hào)順序排列 plt.imshow(images[i])#顯示圖像 plt.title(titles[i])#顯示標(biāo)題 plt.gray() # plt.xticks([]) # plt.yticks([]) plt.axis(’equal’) plt.axis(’off’)plt.show()
輸出接入如下所示:
到此這篇關(guān)于python圖像處理基本操作的文章就介紹到這了,更多相關(guān)python圖像處理操作內(nèi)容請搜索好吧啦網(wǎng)以前的文章或繼續(xù)瀏覽下面的相關(guān)文章希望大家以后多多支持好吧啦網(wǎng)!
相關(guān)文章:

 網(wǎng)公網(wǎng)安備